
There is no shortage of scientific weight-loss studies. With chronic health conditions like obesity, metabolic syndrome, diabetes, heart disease, and hypertension on the rise, many weight-loss researchers are on the hunt for dietary patterns that are effective at reversing the root causes of these conditions.
Most weight-loss studies focus on calorie restriction. The BROAD study is unique in that it was designed to allow people to eat as much as they wanted. Rather than limiting how much people were eating, researchers focused on which foods people ate.
What Did Study Participants Eat?
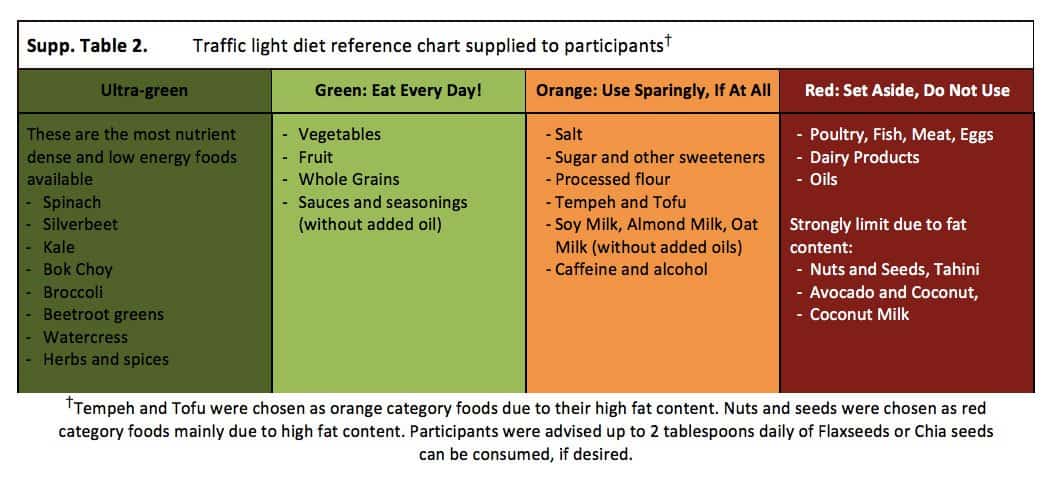
Participants in the intervention group were given specific instructions on what foods to include and exclude from their diet. The chart used to explain the guidelines is shown below. Participants in the intervention group were instructed to eat whole grains, legumes, vegetables, and fruits as the majority of their daily food intake.
They were encouraged to eat starchy foods like potatoes, sweet potatoes, and whole grain breads and pastas, and to avoid animal products (meat, fish, eggs, and dairy products) as well as refined vegetable oils (olive oil, coconut oil, etc.). In addition, participants were told to strongly limit their intake of high-fat plants like nuts, seeds, avocadoes, tofu, and tempeh. They were provided with 50 mcg of vitamin B12 every day.
Participants were not asked to do any exercise, in order to understand the power of dietary change alone on their metabolic health. The intervention group was provided with twice-weekly support sessions sessions for 12 weeks, in which they were taught how to transition to a low-fat, plant-based, whole-food diet in a sustainable manner.
The control group, on the other hand, was simply given standard medical care as usual, and were not given any specific dietary recommendations.
What Were the Results?
Biomarkers for the participants in each group were measured at 3 months and 6 months, and 70% of the intervention participants were followed up after 12 months.
Changes in Body Weight
The control group did show weight loss. At the 3 month mark, controls had lost an average of 3 pounds. The intervention group, however, showed about 6 times more improvement; after the first 3 months, they had lost an average of 18 pounds.
For both groups, the weight loss continued. At 6 months, the control group had lost an average of 6 pounds, and the intervention group had lost an average of 26 pounds. At the 12 month follow-up, the intervention group had sustained that weight loss – by continuing to eat recommended foods without calorie restriction, portion restriction, or mandated exercise.
You’ll notice that weight loss was more rapid for the first 3 months in the intervention group, and then slowed over time. We speculate that this occurred for the following two reasons:
- Individuals needing to lose more weight tend to lose weight more rapidly at the beginning, then the rate of weight loss generally slows over time. However, the majority of these participants were in the obese body mass index range at the beginning of the study, so they had much more than 18 pounds to lose.
- We believe that the cessation of the support-group sessions had a significant influence on slowing the rate of weight loss. Both research and experience continuously show that having a supportive community is not only important but often required to create sustainable lifestyle change. Once the sessions ended after the first 12 weeks, people were no longer experiencing the same level of support, making them more likely to divert from the dietary protocol. The researchers observed results that support this theory in the other biomarkers as well.
Changes in Cholesterol
The average cholesterol at the start of the study was 208 for the intervention group. In just the first 3 months, the average cholesterol dropped to 174, with LDL cholesterol dropping 34 points. This reduction in cholesterol is comparable to the effects of statin drugs, but came without any of the side effects (including an increased risk for type 2 diabetes). The control group achieved a 15 point drop in their LDL cholesterol level.
The reduction in cholesterol for those in the intervention group is not surprising, given the foods they consumed. Their diet contained zero cholesterol, limited saturated fat, and limited refined sugars, the 3 factors most related to increased cholesterol.
Changes in Hemoglobin A1c
Seven people in the intervention group were living with type 2 diabetes, all of which experienced a reduction in A1c values (a marker of 3-month average blood glucose), and half of them discontinued all medications. Average A1c values in the intervention group dropped from 6.0% to 5.5%, whereas average A1c values in the control group increased from 5.5% to 5.7%.
Other Changes
Those in the intervention group that lost weight and improved their health were able to reduce their medication use by an average of 30%. On the other hand, those in the control group increased their use of medication over time.
To top it all off, participants in the intervention group noted an increased quality of life, better self-efficacy with nutrition, and higher self-esteem. Furthermore, they did not note any significant change in enjoyment of food, cost of food, exercise routine.
The TRUE Meaning of a Low-Fat Diet
Most of the literature in the world of diabetes favors the consumption of a low-carbohydrate diet to effectively manage blood glucose in the long-term.
Research that concludes that a low-fat approach is ineffective in reversing diabetes and its complications is done using diets containing an average of 30-35% calories from fat, which is enough dietary fat to induce insulin resistance and kill beta cells.
In order to truly test the effectiveness of a low-fat diet on reversing diabetes and its complications, it is necessary to reduce fat calories to between 10-15%.
Any diet containing more than 15% calories from fat is unlikely to result in favorable changes in A1c, reduced fasting blood glucose, and reductions in insulin resistance.
Below are 6 studies that suggest that a low-carb diet is superior to a low-fat diet for weight loss. In each study below, you will find that the percentage of fat calories is greater than 15%, and is often closer to 30% calories from fat.
A Low-Carbohydrate as Compared with a Low-Fat Diet in Severe Obesity
“The subjects assigned to the low-fat diet received instruction in accordance with the obesity-management guidelines of the National Heart, Lung, and Blood Institute, including caloric restriction sufficient to create a deficit of 500 calories per day, with 30 percent or less of total calories derived from fat.”
Effects of moderate variations in macronutrient composition on weight loss and reduction in cardiovascular disease risk in obese, insulin-resistant adults
Fifty-seven randomly assigned, insulin-resistant, obese persons completed a 16-wk calorie-restricted diet with 15% of energy as protein and either 60% and 25% or 40% and 45% of energy as carbohydrate and fat, respectively. Baseline and post weight-loss insulin resistance; daylong glucose, insulin, and triacylglycerol concentrations; fasting lipid and lipoprotein concentrations; and markers of endothelial function were quantified.
Weight Loss with a Low-Carbohydrate, Mediterranean, or Low-Fat Diet
The low-fat, restricted-calorie diet was based on American Heart Association guidelines. We aimed at an energy intake of 1500 kcal per day for women and 1800 kcal per day for men, with 30% of calories from fat, 10% of calories from saturated fat, and an intake of 300 mg of cholesterol per day.
Effects of 4 weight-loss diets differing in fat, protein, and carbohydrate on fat mass, lean mass, visceral adipose tissue, and hepatic fat: results from the POUNDS LOST trial
The following 4 diets were tested in this study: 1) a low-fat, average-protein diet (20% fat, 15% protein, and 65% carbohydrate, 2) a low-fat, high-protein diet (20% fat, 25% protein, and 55% carbohydrate), 3) a high-fat, average-protein diet (40% fat, 15% protein, and 45% carbohydrate), and 4) a high-fat, high-protein diet (40% fat, 25% protein, and 35% carbohydrate).
A low-carbohydrate, ketogenic diet versus a low-fat diet to treat obesity and hyperlipidemia: a randomized, controlled trial
Low-carbohydrate diet (initially, <20 g of carbohydrate daily) plus nutritional supplementation, exercise recommendation, and group meetings, or low-fat diet (<30% energy from fat, <300 mg of cholesterol daily, and deficit of 500 to 1000 kcal/d) plus exercise recommendation and group meetings.
Effects of Low-Carbohydrate and Low-Fat Diets: A Randomized Trial
A low-carbohydrate (<40 g/d) or low-fat (<30% of daily energy intake from total fat [<7% saturated fat]) diet. Both groups received dietary counseling at regular intervals throughout the trial.
Take Home Message
The BROAD study showed that when eating a low-fat, plant-based, whole food diet, people will lose weight -- even when eating as much as they want, and without adding any exercise.
Furthermore, beyond weight loss, this dietary approach also improves other biomarkers such as cholesterol and hemoglobin A1c.
This is the same approach that we take in our coaching program, and we experience similar results with those that follow our dietary approach.
The answer to long-term health is not portion control or calorie restriction, but instead low-fat, plant-based, whole-foods.
If the results of this study seem too good to be true, we invite you to try the approach for yourself. You have nothing to lose – except excess weight!
Lower Your A1c and Get to Your Ideal Body Weight ... Guaranteed

Your results are guaranteed. Join more than 10,000 ecstatic members today
Personalized coaching puts you in immediate control of your diabetes health, helps you gain energy, improves your quality of life, and reduces or eliminates your meds.